
Stock alerts app for NYSE and NASDAQ traders
Don't be a sheep in a world of wolves.
Retail investors often graze innocently without information. Empower yourself with mathematical and statistical tools to make your own decisions. Sheep Trade is a stock alerts app with custom alerts, technical indicators and portfolio tracking for US stocks, ETFs and crypto.

Why use a stock alerts app?
Tools designed for the smart investor.
Smart Alerts
Stop staring at charts all day. Set complex conditions with our flexible formula engine. Combine price updates, volume spikes and technical patterns.
- Custom formula builder
- Push notifications on your phone
- Alert activation history with the time of each alert
- Track stocks, ETFs and crypto
Portfolio Management
A unified view of your financial universe. Track positions across markets, see your asset allocation, follow daily gains and protect your capital.
- Global market coverage
- Performance analysis
- Privacy-focused storage
Math and Statistics
Trading is a game of probabilities. Replace emotional decisions with rigorous statistical analysis. Use our tools to assess risk, understand volatility and refine your strategy.
- Technical indicators (SMA, CCI, RSI, ROC, Bollinger, MACD, standard deviation)
- Statistical pairs and spread alerts
- Data-driven risk assessment
See Sheep Trade inside
The app's main screens, organized like the Stocks, Alerts and Portfolio tabs.
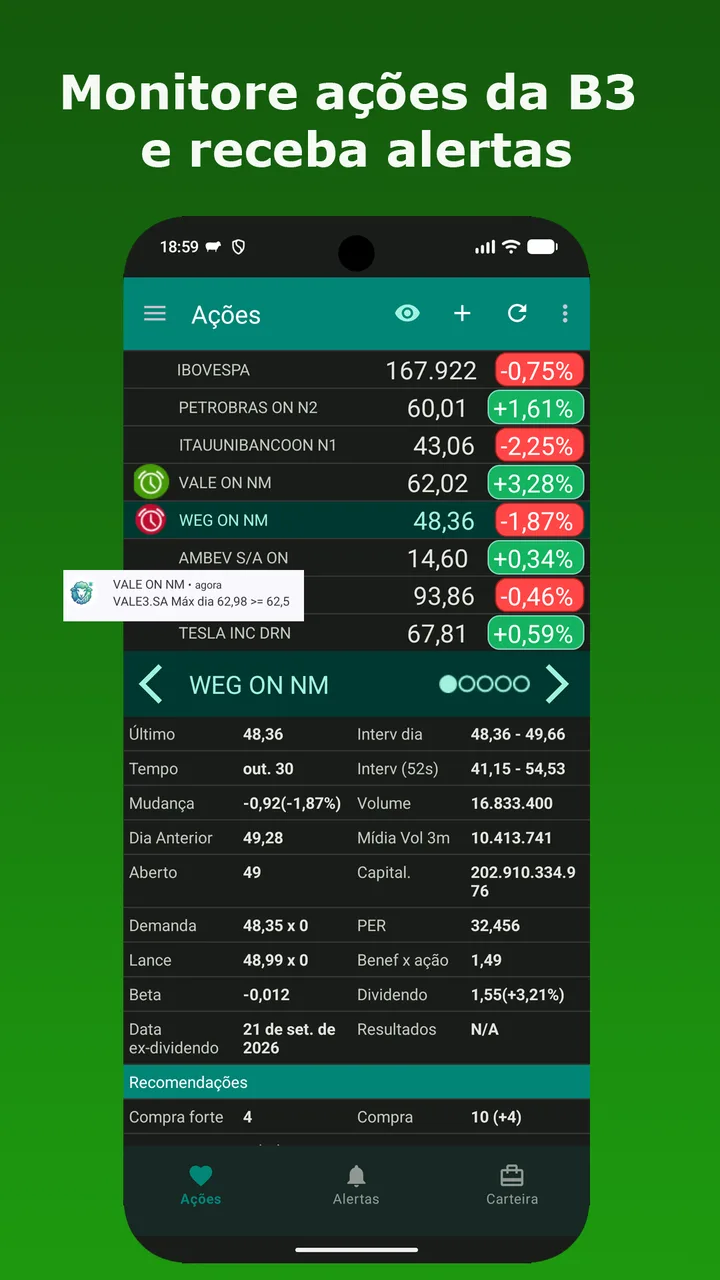
Monitor stocks and get alerts
Follow your NYSE and NASDAQ watchlist with price and daily change. Alarm icons mark stocks with alerts, and a notification tells you when one triggers. Tap a stock for last price, day and 52-week range, volume, market cap, P/E, dividend, beta, ex-dividend date and analyst recommendations. Sort the list by position, symbol, alert, change %, volume ratio, market, proximity to the 52-week high or low, or company name.
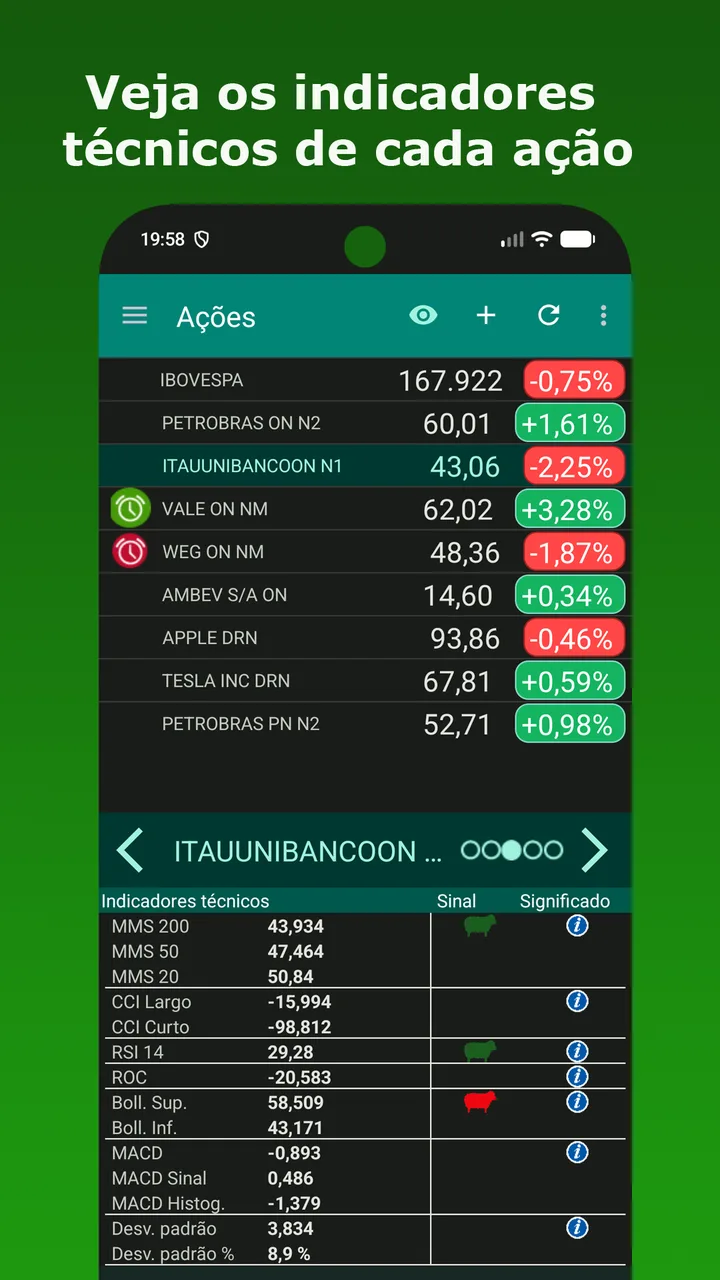
Technical indicators for every stock
See SMA 200, 50 and 20, CCI, RSI 14, ROC, Bollinger Bands, MACD and standard deviation. The Signal column shows green or red sheep, and the info button explains each indicator. Indicators use daily data, and the current quote is treated as if today had just closed, so RSI or the 20-day SMA change during the session and become final at the close.
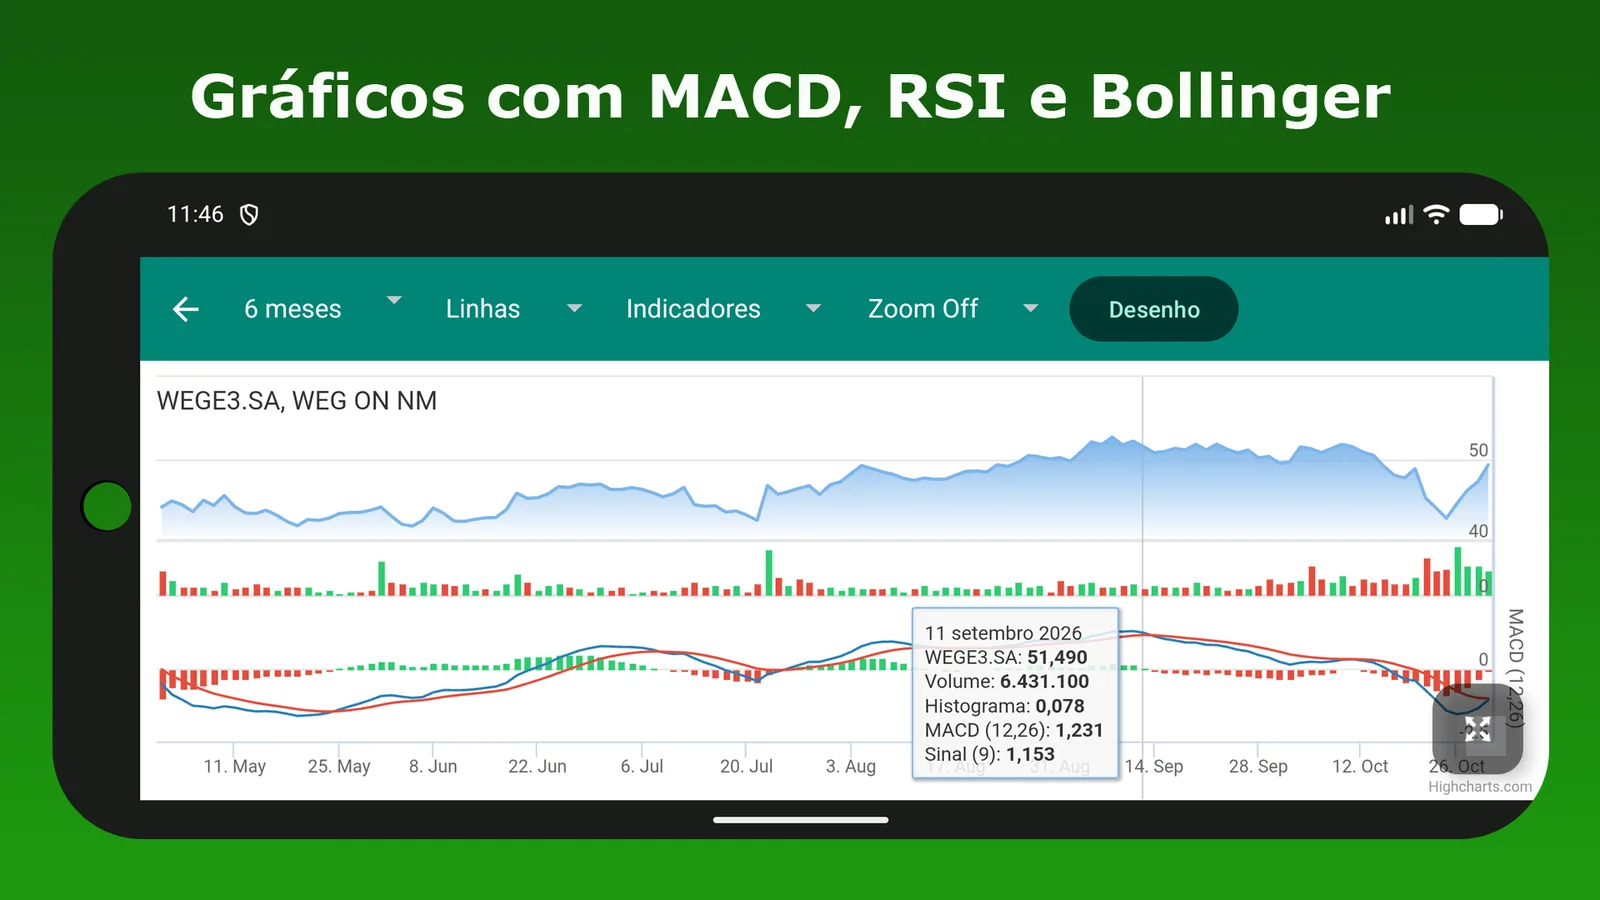
Charts with technical indicators
Open a chart and customize it:
- Period: 1 day, 5 days, 1 month, 3 months, 6 months, 1 year, 2 years, 5 years or max. Each point is 2 minutes in the 1-day chart, 15 minutes in 5 days, 1 hour in 1 month and 1 day from 3 months.
- Chart type: line, bar or candlestick.
- Indicators: SMA 20, 50 and 200, upper and lower Bollinger Bands, RSI 14 and MACD, plus volume.
- Zoom: pinch to enlarge the part of the chart you care about.
- Drawing: draw lines over the chart, for example to mark trends.
- Day details: tap the chart to see price, volume, histogram, MACD and signal line.
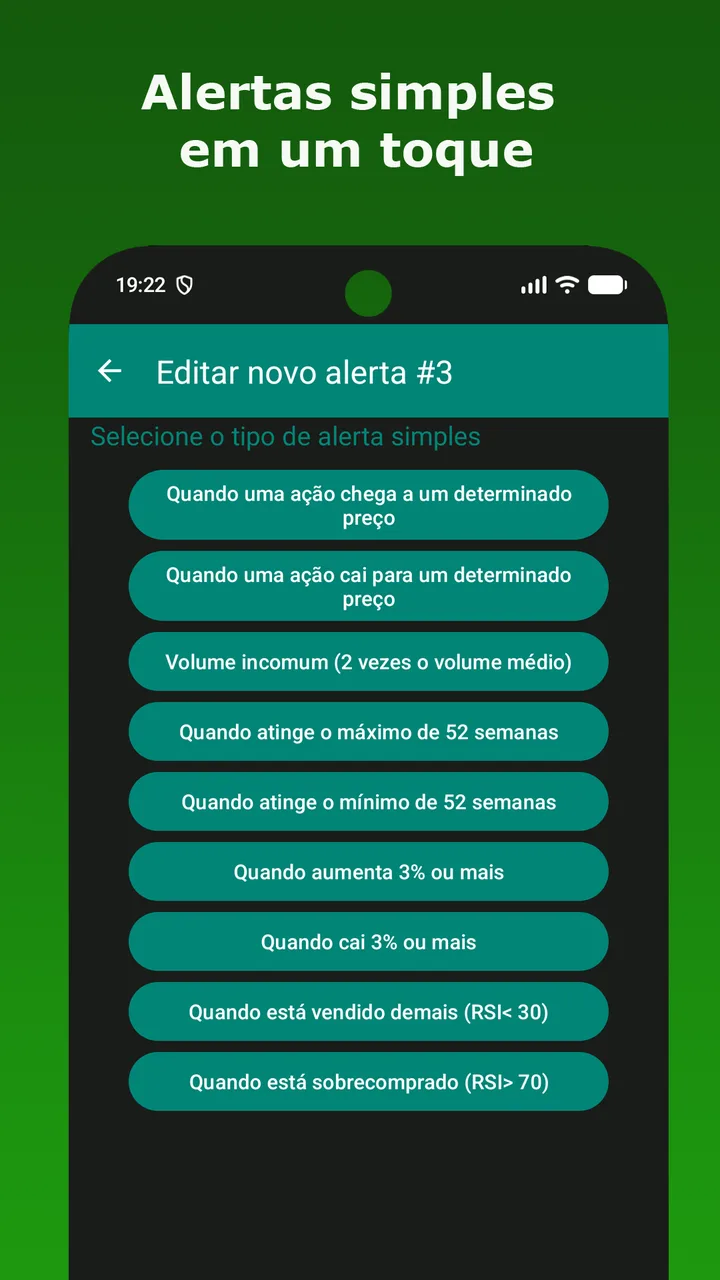
Simple alerts in one tap
Pick a ready-made alert: target price, unusual volume (2x average), 52-week high or low, a rise or fall of 3% or more, and RSI below 30 or above 70.
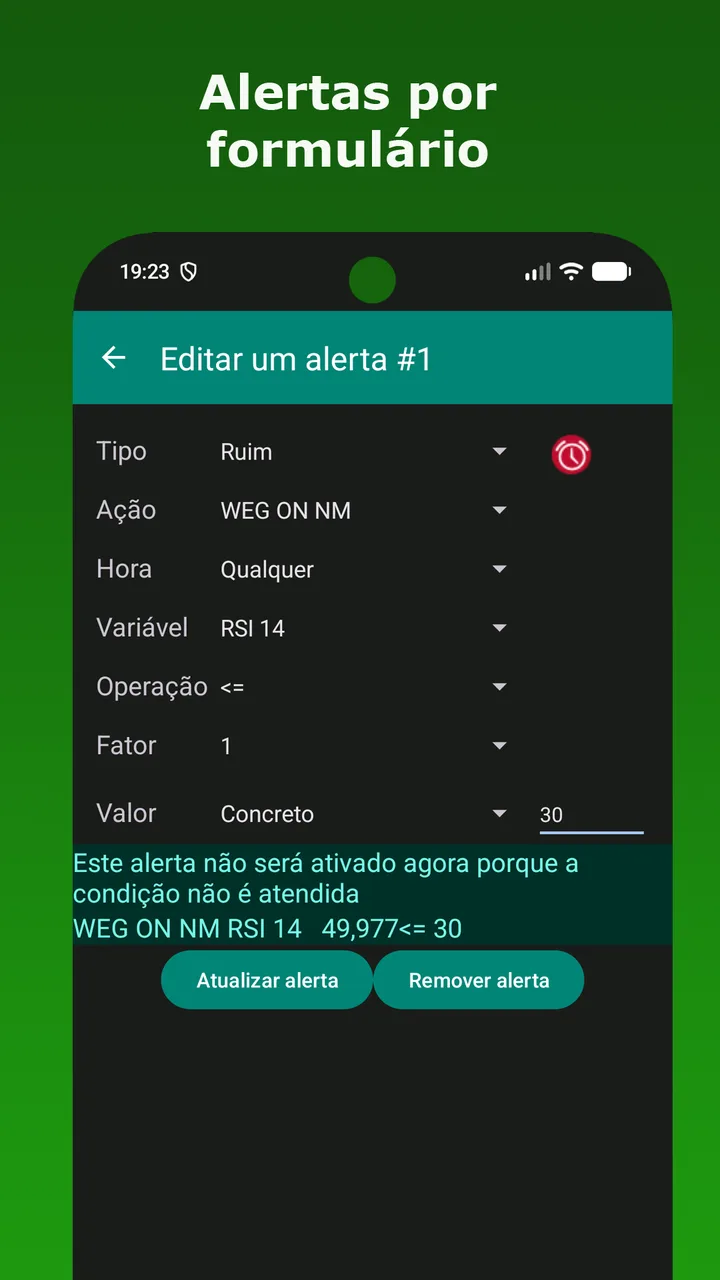
Alerts by form
Choose the stock, the variable (such as RSI 14 or MACD Signal), the operation and the value. Set the alert type (good, bad or caution), which changes its color, and a time condition in your own time zone, for example before 10:00 to catch heavy volume right after the open. Before saving, the app shows whether the alert would trigger now and why.
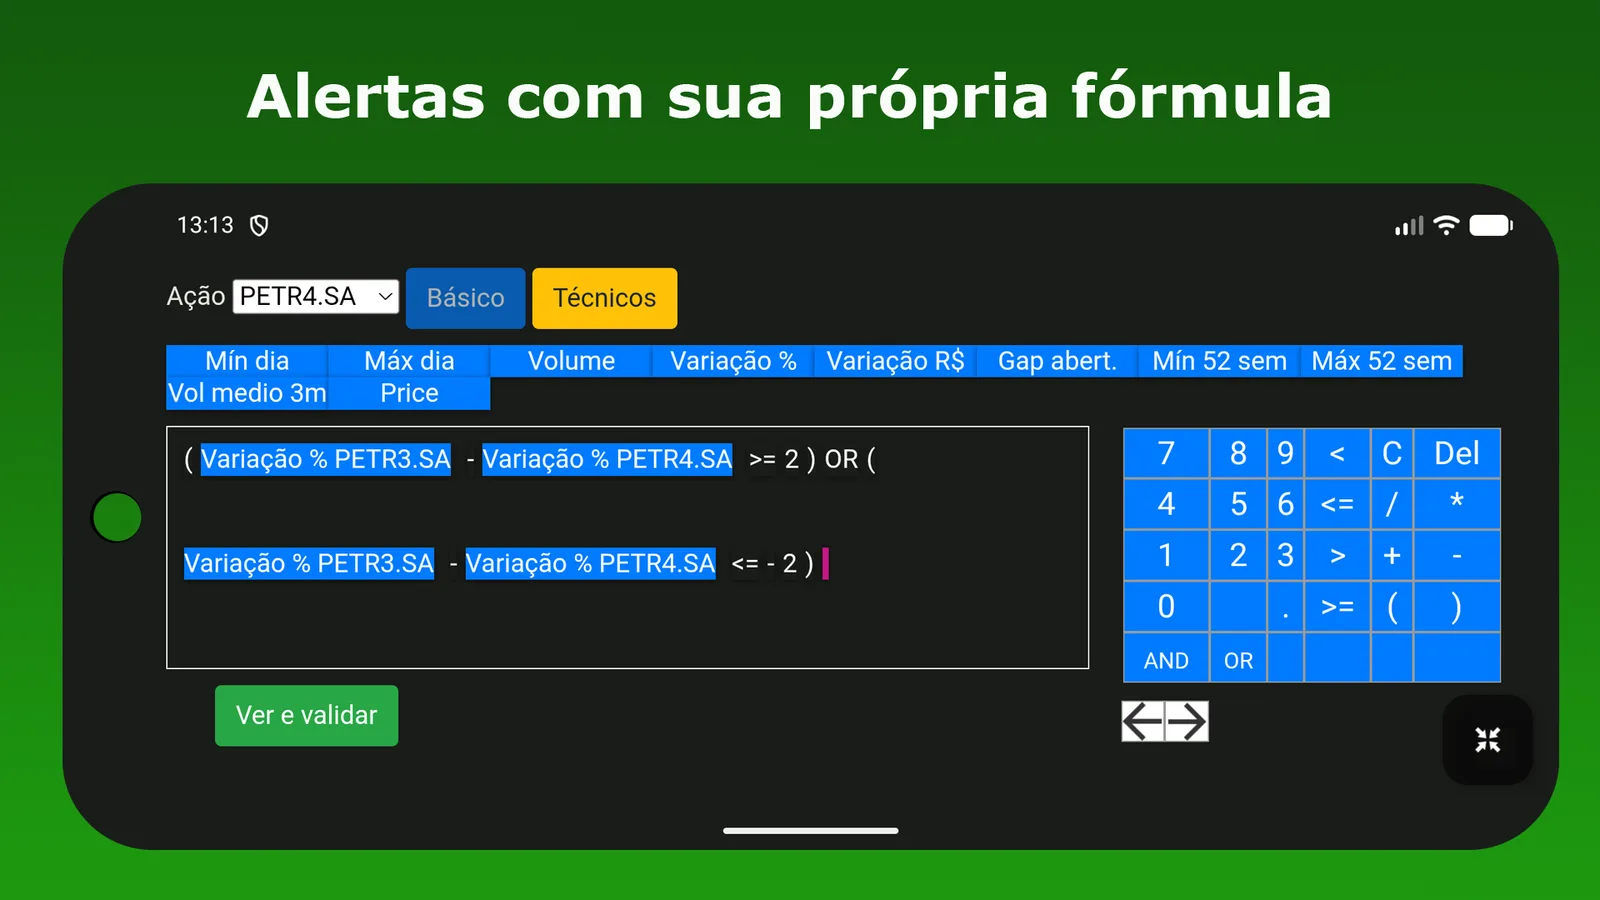
Alerts with your own formula
Combine basic data and technical indicators from one or several stocks with the editor keypad, join conditions with AND and OR, and validate the formula before activating. That lets you build pairs trading and statistical arbitrage alerts: the app compares two stocks and warns you when their relationship moves out of its normal range. US examples:
- Two share classes (GOOGL and GOOG): alert when they diverge by more than 1 percentage point on the day, up or down:
(Change % GOOGL - Change % GOOG >= 1) OR (Change % GOOGL - Change % GOOG <= -1) - Direct competitors (KO and PEP): alert when one beats the other by 2 points on the day:
Change % KO - Change % PEP >= 2 - ETF ratio (QQQ and SPY): alert when the price ratio falls below a level you consider cheap from its history:
Price QQQ / Price SPY < level - Stock vs S&P 500 (NVDA and ^GSPC): alert when the stock beats the index by 3 points on the day:
Change % NVDA - Change % ^GSPC >= 3
Ideas, not investment advice. Pairs trading can involve short positions, which carry their own risks.
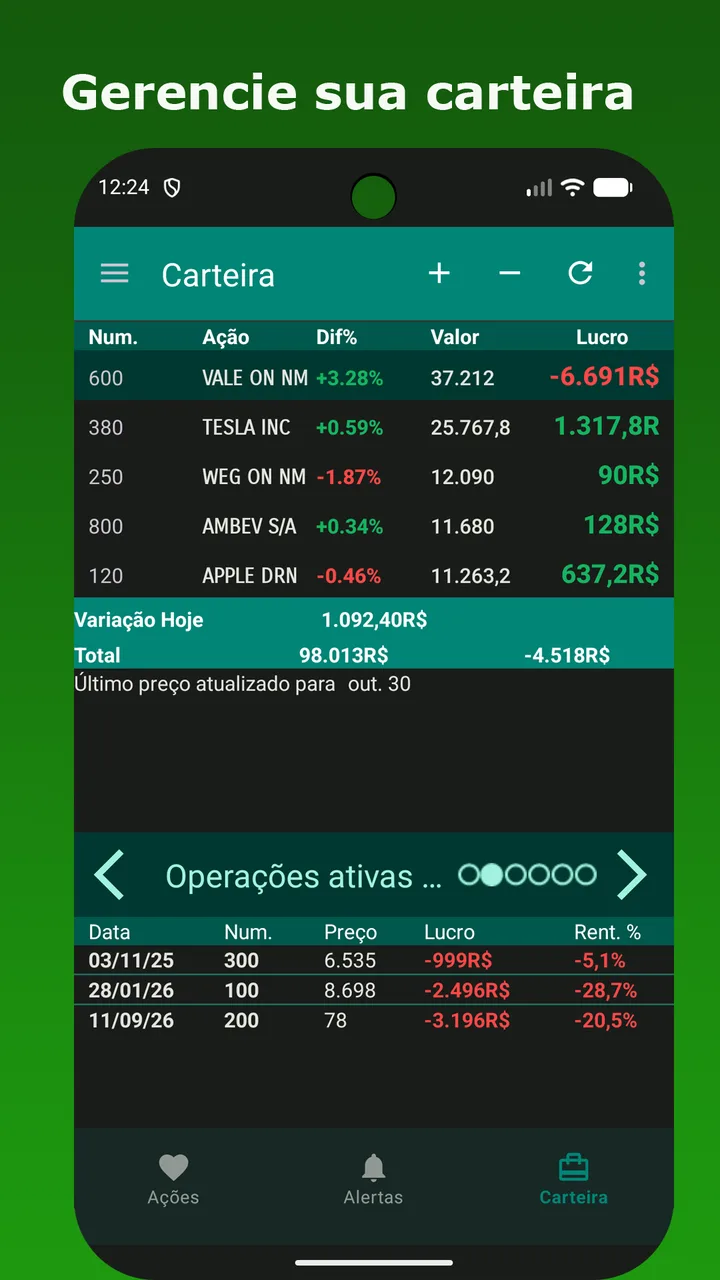
Manage your portfolio
See each position with quantity, daily change, value and profit, plus today's change and the portfolio total. Below, swipe through 6 detail screens:
- Price information for the selected stock.
- Open operations on that stock: date, quantity, price, profit and return %.
- Portfolio evolution chart, full size.
- Portfolio value over time, in numbers.
- Realized profit per year: gains and losses of closed operations.
- 3-bar chart for the selected stock: contribution to portfolio return, contribution to portfolio value and share of the portfolio's purchase cost.
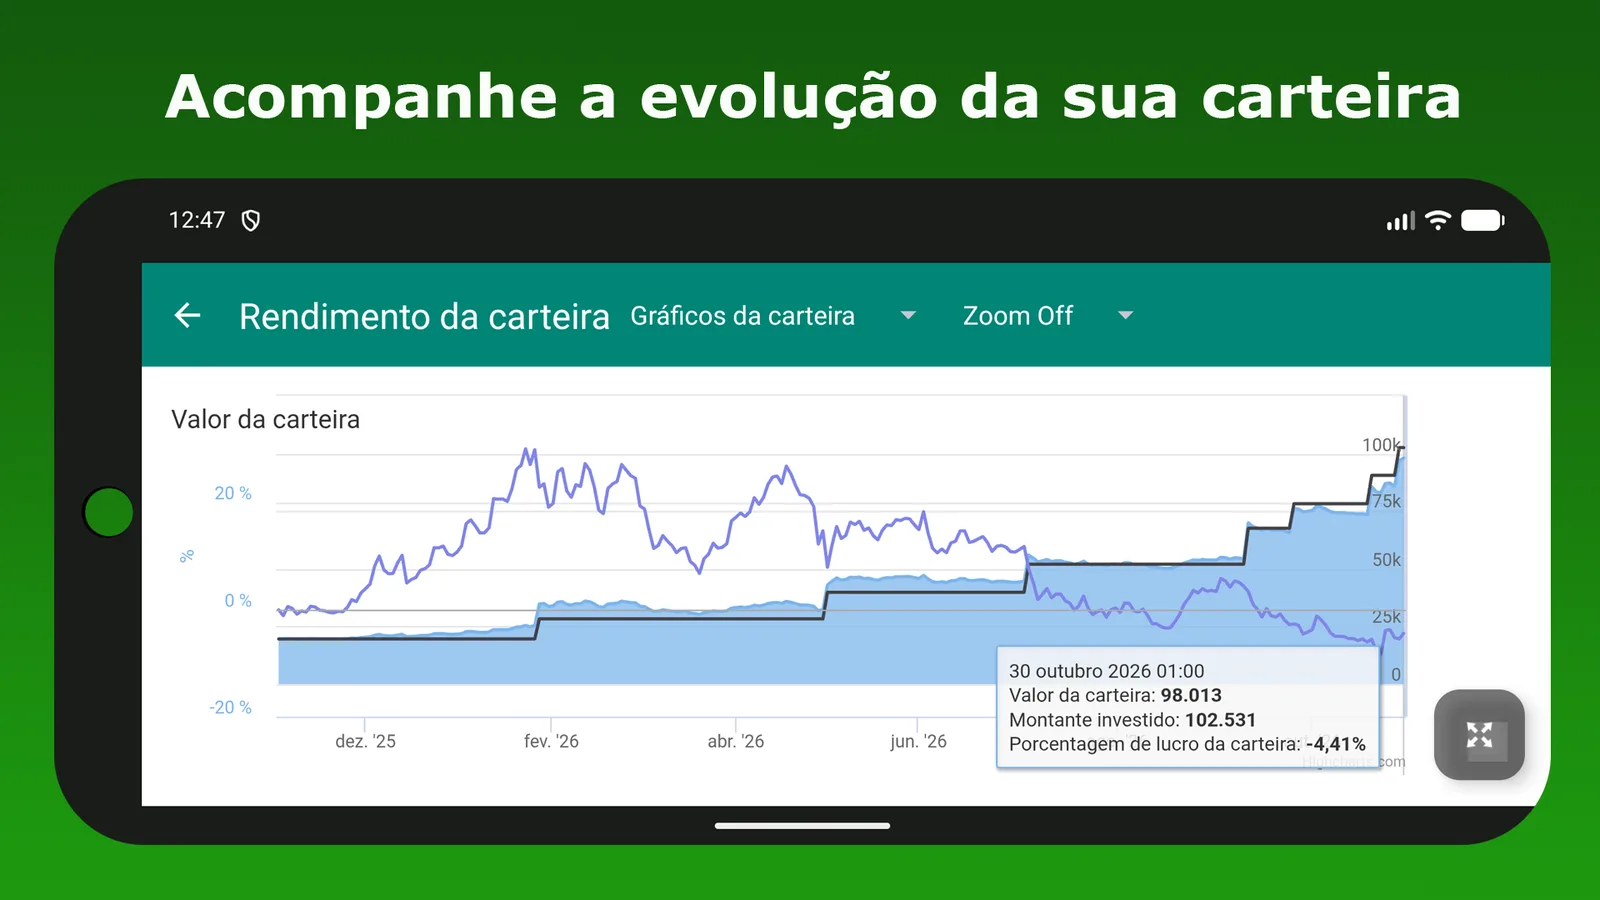
Track your portfolio's evolution
Choose what the portfolio chart shows:
- Portfolio value
- Amount invested
- Portfolio profit percentage
- Portfolio profit
- Total accumulated profit
- Profit accumulated over the last 12 months
- Last 12 months' profit + portfolio profit
Tap a date to see that day's values. Zoom is available.
Three ways to create a stock alert
From fastest to most advanced, you choose how much control you want.
Simple alerts
Pick a ready-made alert: target price, unusual volume (2x average), 52-week high or low, a move of 3% or more, and RSI below 30 or above 70.
Form alerts
Choose the stock, the variable (such as MACD Signal), the operation and the value. Set an alert type and a time condition in your time zone. Before saving, the app shows whether the alert would trigger now and why.
Example: get warned about unusually high volume in the first minutes after the market opens.
Your own formula
Combine basic data and technical indicators from several stocks at once, use AND and OR, and validate the formula before activating.
Example: add up the daily change % of AAPL, MSFT and NVDA and get alerted when the total is 5 or more.
What alerts for each indicator are good for
Choose the indicator, set the condition and get notified without watching the chart. The indicators use the current quote as if today had just closed, so alerts can fire during the session and values can change until the close. If the condition happens two or three times in a session, you get one alert each time, and the app keeps the time of each in the alert's activation history. Examples are ideas, not investment advice.
RSI alerts
The Relative Strength Index measures the speed of recent gains and losses from 0 to 100. Below 30 often means oversold, above 70 overbought.
Example: get warned when AAPL's RSI falls below 30 (possible entry) or rises above 70 (possible profit-taking).
MACD alerts
Compares two exponential moving averages to show trend and momentum changes. A cross of the MACD and its signal line is one of the most used triggers.
Example: get alerted when the MACD of SPY crosses above its signal line (possible start of an uptrend) or below it (possible weakening).
SMA 20, 50 and 200
Simple moving averages smooth the price and show short, medium and long-term trend. The 200-day SMA is the classic long-term reference.
Example: alert when TSLA closes above its SMA 200, or when the SMA 50 crosses the SMA 200 (the golden cross and death cross).
Bollinger Bands
They draw a channel around the moving average based on volatility. Price near a band shows an extended move, and narrow bands often come before strong moves.
Example: get warned when the price of NVDA drops below the lower band during the session, for example in a sharp morning drop. If it recovers by the close, you were already alerted to the move and could evaluate the opportunity.
CCI alerts
The Commodity Channel Index shows how far the price is from its recent average. Readings above +100 or below -100 mark unusual moves.
Example: alert when the CCI leaves the area below -100 and turns back up, a sign some traders use to confirm a recovery.
ROC alerts
Rate of Change measures the percentage change in price versus a few periods ago and shows whether a stock is gaining or losing momentum.
Example: get warned when the ROC turns from negative to positive, meaning the decline lost strength.
Standard deviation
Quantifies how much the price fluctuates, useful to spot rising volatility and size position risk.
Example: alert when the standard deviation rises above the stock's usual level.
Custom formulas
Combine price, averages and indicators with math operations (+, -, *, /), comparisons (<, <=, >, >=), parentheses and the AND and OR operators in one formula, including several stocks at once.
Example: alert when RSI 14 is below 30 AND the price is above the SMA 200, to filter short dips inside an uptrend.
Sheep signals: see at a glance what the indicators say
On the technical indicators screen, the Signal column shows a green or red sheep when an indicator produces a possible signal. They are points of attention, not investment advice, and they can appear and disappear during the session.
| Indicator | Green sheep | Red sheep |
|---|---|---|
| SMA 20, 50 and 200 |
|
|
| RSI | RSI at or below 30 (oversold). | RSI at or above 70 (overbought). |
| MACD | MACD crosses above the signal line. | MACD crosses below the signal line. |
| CCI | Long CCI above 100 and short CCI below -100. | Long CCI below -100 and short CCI above 100. |
| ROC | ROC at or below -30. | ROC at or above 30. |
| Bollinger Bands | Day high above the upper band. | Day low below the lower band. |
| Standard deviation | Calculated over the last 20 sessions. Measures volatility and gives no signal. | |
Supported markets
US quotes (NYSE, NASDAQ, OTC) are real-time. Quotes from some other markets, such as the UK or Australia, can be delayed.
We support quotes from more than 30 global exchanges, in real time or delayed depending on the market.
Note: the app checks your alerts at the interval you configure (for example every 5, 10, 15, 30 or 60 minutes), so an alert arrives after the next check. Sheep Trade is a support tool and is not investment advice.
Frequently asked questions
Is Sheep Trade free?
Yes, you can download and use it for free. The app shows ads, and a Premium option removes them.
Can I create RSI and MACD alerts for NYSE and NASDAQ stocks?
Yes. The indicators are available for the supported assets, including US stocks, ETFs and crypto.
Are US quotes real-time?
Yes, quotes for the US market are real-time. Quotes from some other markets, such as the UK or Australia, can be delayed. The app checks your alerts at the interval you set (for example every 5, 10, 15, 30 or 60 minutes), so an alert arrives after the next check.
Why didn't my alert trigger or why did it arrive late?
Alerts are verified at the interval you configured, and some phone makers (such as Xiaomi, Huawei, Samsung or OnePlus) have aggressive battery managers that can block the app in the background. On the App Health screen you can see the permission status, when the last check ran and when the next one is scheduled, and you get a warning if something may be blocking the app.
Is my portfolio data safe?
Your portfolio data stays with you. See the Privacy Policy.
Where can I find more answers?
See the app FAQ.